
![]()
2022 Realistic DA-100 100% Pass Guaranteed Download Exam Q&A
Accurate DA-100 Answers 365 Days Free Updates
NEW QUESTION 30
You import two Microsoft Excel tables named Customer and Address into Power Query. Customer contains the following columns:
* Customer ID
* Customer Name
* Phone
* Email Address
* Address ID
Address contains the following columns:
* Address ID
* Address Line 1
* Address Line 2
* City
* State/Region
* Country
* Postal Code
The Customer ID and Address ID columns represent unique rows.
You need to create a query that has one row per customer. Each row must contain City, State/Region, and Country for each customer.
What should you do?
- A. Group the Customer and Address tables by the Address ID column.
- B. Append the Customer and Address tables.
- C. Transpose the Customer and Address tables.
- D. Merge the Customer and Address tables.
Answer: D
Explanation:
There are two primary ways of combining queries: merging and appending.
When you have one or more columns that you'd like to add to another query, you merge the queries.
When you have additional rows of data that you'd like to add to an existing query, you append the query.
Reference:
https://docs.microsoft.com/en-us/power-bi/connect-data/desktop-shape-and-combine-data
NEW QUESTION 31
You are preparing a financial report in Power BI.
You connect to the data stored in a Microsoft Excel spreadsheet by using Power Query Editor as shown in the following exhibit.
You need to prepare the data to support the following:
Visualizations that include all measures in the data over time
Year-over-year calculations for all the measures
Which four actions should you perform in sequence? To answer, move the appropriate actions from the list of actions to the answer area and arrange them in the correct order.
Answer:
Explanation:
1 - Transpose the table
2 - Unpivot all the columns other than Measure
3 - Rename the Measure column as year
4 - Change the data type of the year column to Date
Reference:
https://support.microsoft.com/en-us/office/unpivot-columns-power-query-0f7bad4b-9ea1-49c1-9d95-f588221c7098
NEW QUESTION 32
You have a dataset named Pens that contains the following columns:
Unit Price
Quantity Ordered
You need to create a visualization that shows the relationship between Unit Price and Quantity Ordered. The solution must highlight orders that have a similar unit price and ordered quantity.
Which type of visualization and which feature should you use? To answer, select the appropriate options in the answer area.
NOTE: Each correct selection is worth one point.
Answer:
Explanation:
Reference:
https://docs.microsoft.com/en-us/power-bi/visuals/power-bi-visualization-scatter
NEW QUESTION 33
You have a report that contains a bar chart and a column chart. The bar chart shows customer count by customer segment. The column chart shows sales by month.
You need to ensure that when a segment is selected in the bar chart, you see which portion of the total sales for the month belongs to the customer segment.
How should the visual interactions be set on the column chart when the bar chart is selected?
- A. filter
- B. no impact
- C. highlight
Answer: C
Explanation:
Higlight will show the portion of Total Sales.
NEW QUESTION 34
You have a table that contains sales data and approximately 1,000 rows. You need to identify outliers in the table.
Which type of visualization should you use?
- A. scatter plot
- B. donut chart
- C. area chart
- D. pie chart
Answer: A
NEW QUESTION 35
You need to create a measure that will return the percentage of late orders.
How should you complete the DAX expression? To answer, select the appropriate options in the answer area.
NOTE: Each correct selection is worth one point.
Answer:
Explanation:
Reference:
https://docs.microsoft.com/en-us/dax/calculate-function-dax
https://docs.microsoft.com/en-us/dax/filter-function-dax
NEW QUESTION 36
You need to grant access to the business unit analysts.
What should you configure? To answer, select the appropriate options in the answer area.
NOTE: Each correct selection is worth one point.
Answer:
Explanation:
Reference:
https://www.nickyvv.com/2019/08/the-new-power-bi-workspace-viewer-role-explained.html
NEW QUESTION 37
You have a dataset named Pens that contains the following columns:
* Unit Price
* Quantity Ordered
You need to create a visualization that shows the relationship between Unit Price and Quantity Ordered. The solution must highlight orders that have a similar unit price and ordered quantity.
Which type of visualization and which feature should you use? To answer, select the appropriate options in the answer area.
NOTE: Each correct selection is worth one point.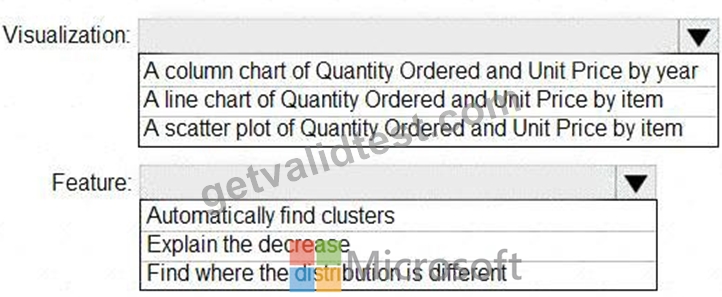
Answer:
Explanation:
Explanation
Box 1: A scatter plot...
A scatter chart always has two value axes to show: one set of numerical data along a horizontal axis and another set of numerical values along a vertical axis. The chart displays points at the intersection of an x and y numerical value, combining these values into single data points. Power BI may distribute these data points evenly or unevenly across the horizontal axis. It depends on the data the chart represents.
Box 2: Automatically find clusters
Scatter charts are a great choice to show patterns in large sets of data, for example by showing linear or non-linear trends, clusters, and outliers.
Reference:
https://docs.microsoft.com/en-us/power-bi/visuals/power-bi-visualization-scatter
NEW QUESTION 38
You build a report to analyze customer transactions from a database that contains the tables shown in the following table.
You import the tables.
Which relationship should you use to link the tables?
- A. one-to-many from Customer to Transaction
- B. one-to-many from Transaction to Customer
- C. many-to-many between Customer and Transaction
- D. one-to-one between Customer and Transaction
Answer: D
NEW QUESTION 39
You are creating a quick measure as shown in the following exhibit.
You need to create a monthly rolling average measure for Sales over time-How should you configure the quick measure calculation? To answer, select the appropriate options in the answer area.
NOTE: Each correct selection is worth one point.
Answer:
Explanation:
Reference:
https://docs.microsoft.com/en-us/power-bi/transform-model/desktop-quick-measures
NEW QUESTION 40
You have two tables named Customers and Invoice in a Power BI model. The Customers table contains the following fields:
CustomerID
Customer City
Customer State
Customer Name
Customer Address 1
Customer Address 2
Customer Postal Code
The Invoice table contains the following fields:
Order ID
Invoice ID
Invoice Date
Customer ID
Total Amount
Total Item Count
The Customers table is related to the Invoice table through the Customer ID columns. A customer can have many invoices within one month.
The Power BI model must provide the following information:
The number of customers invoiced in each state last month
The average invoice amount per customer in each postal code
You need to define the relationship from the Customers table to the Invoice table. The solution must optimize query performance.
What should you configure? To answer, select the appropriate options in the answer area.
NOTE: Each correct selection is worth one point.
Answer:
Explanation:
Reference:
https://docs.microsoft.com/en-us/power-bi/transform-model/desktop-relationships-understand
NEW QUESTION 41
You are building a dataset from a JSON file that contains an array of documents.
You need to import attributes as columns from all the documents in the JSON file. The solution must ensure that date attributes can be used as date hierarchies in Microsoft Power BI reports.
Which three actions should you perform in sequence? To answer, move the appropriate actions from the list of actions to the answer area and arrange them in the correct order.
Answer:
Explanation:
Explanation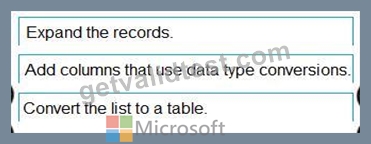
Step 1: Expand the records.
First Open Power BI desktop and navigate to Power Query, import the JSON file, then load the data, click on the record to expand it and to see the record and list.
Step 2: Add columns that use data type conversions.
Step 3: Convert the list to a table
NEW QUESTION 42
You need to create a visual as shown in the following exhibit.
The indicator color for Total Sales will be based on % Growth to Last Year.
The solution must use the existing calculations only.
How should you configure the visual? To answer, select the appropriate options in the answer area.
NOTE: Each correct selection is worth one point.
Answer:
Explanation: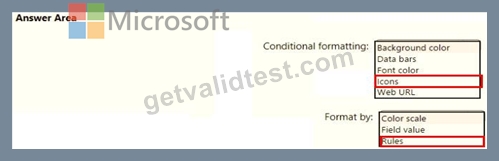
NEW QUESTION 43
You have four sales regions. Each region has multiple sales managers.
You implement row-level security (RLS) in a data model. You assign the relevant distribution lists to each role.
You have sales reports that enable analysis by region. The sales managers can view the sales records of their region. The sales managers are prevented from viewing records from other regions.
A sales manager changes to a different region.
You need to ensure that the sales manager can see the correct sales data.
What should you do?
- A. From Microsoft Power Bl Desktop, edit the Row-Level Security setting for the reports.
- B. Request that the sales manager be added to the correct Azure Active Directory group.
- C. Manage the permissions of the underlying dataset
- D. Change the Microsoft Power Bl license type of the sales manager.
Answer: B
Explanation:
Using AD Security Groups, you no longer need to maintain a long list of users.
All that you will need to do is to put in the AD Security group with the required permissions and Power BI will do the REST! This means a small and simple security file with the permissions and AD Security group.
Note: Configure role mappings
Once published to Power BI, you must map members to dataset roles.
Members can be user accounts or security groups. Whenever possible, we recommend you map security groups to dataset roles. It involves managing security group memberships in Azure Active Directory. Possibly, it delegates the task to your network administrators.
Reference:
https://www.fourmoo.com/2018/02/20/dynamic-row-level-security-is-easy-with-active-directory-security-groups/
https://docs.microsoft.com/en-us/power-bi/guidance/rls-guidance
NEW QUESTION 44
You build a report about warehouse inventory data. The dataset has more than 10 million product records from
200 warehouses worldwide. You have a table named Products that contains the columns shown in the following table.
Warehouse managers report that it is difficult to use the report because the report uses only the product name in tables and visuals. The product name is contained within the ProductDescription column and is always the fourth value.
You need to modify the report to support the warehouse managers requirement to explore inventory levels at different levels of the product hierarchy. The solution must minimize the model size.
Which three actions should you perform in sequence? To answer, move the appropriate actions from the list of actions to the answer area and arrange them in the correct order.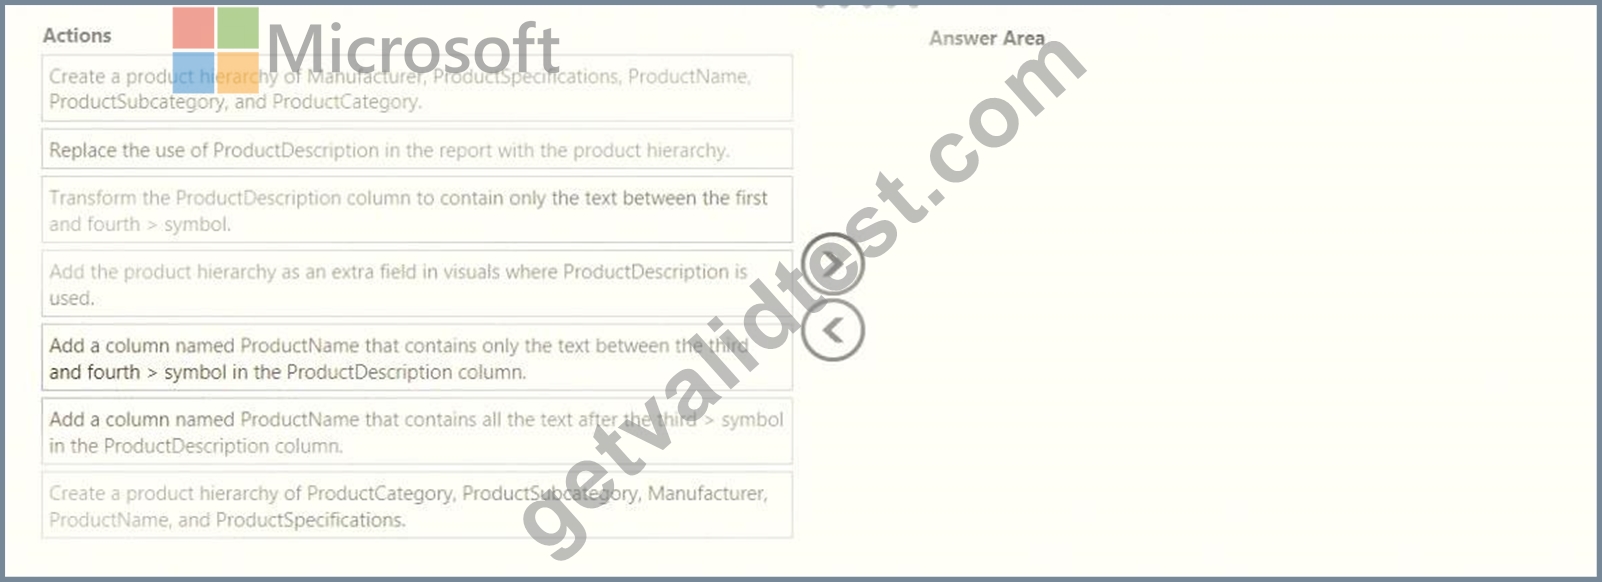
Answer:
Explanation:
Explanation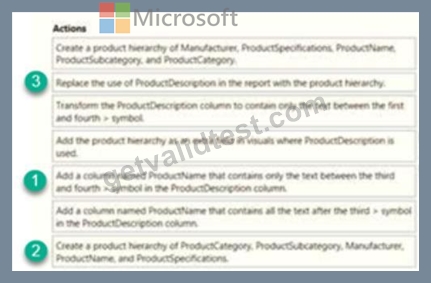
NEW QUESTION 45
You have a Microsoft Power Bl workspace.
You need to grant the user capabilities shown in the following table.
The solution must use the principle of least privilege.
Which user role should you assign to each user? To answer, drag the appropriate roles to the correct users. Each role may be used once, more than once, or not at all. You may need to drag the split bar between panes or scroll to view content.
NOTE: Each correct selection is worth one point.
Answer:
Explanation:
NEW QUESTION 46
You need to grant access to the business unit analysts.
What should you configure? To answer, select the appropriate options in the answer area.
NOTE: Each correct selection is worth one point.
Answer:
Explanation:
Explanation
Box 1: The Viewer role to the workspace
The Viewer role gives a read-only experience to its users. They can view dashboards, reports, or workbooks in the workspace, but can't browse the datasets or dataflows. Use the Viewer role wherever you would previously use a classic workspace set to "Members can only view Power BI content".
Box 2: Build
The analysts must be able to build new reports from the dataset that contains the profit and loss data.
Scenario: The reports must be made available to the board from powerbi.com.
The analysts responsible for each business unit must see all the data the board sees, except the profit and loss data, which must be restricted to only their business unit's data. The analysts must be able to build new reports from the dataset that contains the profit and loss data, but any reports that the analysts build must not be included in the quarterly reports for the board. The analysts must not be able to share the quarterly reports with anyone.
Reference:
https://www.nickyvv.com/2019/08/the-new-power-bi-workspace-viewer-role-explained.html
NEW QUESTION 47
You have a folder of monthly transaction extracts.
You plan to create a report to analyze the transaction data.
You receive the following email message: "Hi. I've put 24 files of monthly transaction data onto the shared drive. File Transactions201901.csv through Transactions201912.csv have the latest set of columns, but files Transactions201801.csv to Transactions201812.csv have an older layout without the extra fields needed for analysis. Each file contains 10 to 50 transactions." You get data from the folder and select Combine & Load. The Combine Files dialog box is shown in the exhibit. (Click the Exhibit tab.)
For each of the following statements, select Yes if the statement is true. Otherwise, select No.
NOTE: Each correct selection is worth one point.
Answer:
Explanation:
NEW QUESTION 48
You need to create a calculated column to display the month based on the reporting requirements.
Which DAX expression should you use?
- A. FORMAT('Date'[date_id], "MMM") & "" & FORMAT('Date'[2022], "#")
- B. FORMAT('Date' [date], "M YY")
- C. FORMAT('Date'[date], "MMM YYYY")
- D. FORMAT('Date' [date_id], "MMM YYYY")
Answer: D
Explanation:
Scenario: In the Date table, the date_id column has a format of yyyymmdd. Users must be able to see the month in reports as shown in the following example: Feb 2020.
Prepare the Data
Testlet 2
Case Study
This is a case study. Case studies are not timed separately. You can use as much exam time as you would like to complete each case. However, there may be additional case studies and sections on this exam. You must manage your time to ensure that you are able to complete all questions included on this exam in the time provided.
To answer the questions included in a case study, you will need to reference information that is provided in the case study. Case studies might contain exhibits and other resources that provide more information about the scenario that is described in the case study. Each question is independent of the other question on this case study.
At the end of this case study, a review screen will appear. This screen allows you to review your answers and to make changes before you move to the next section of the exam. After you begin a new section, you cannot return to this section.
To start the case study
To display the first question on this case study, click the Next button. Use the buttons in the left pane to explore the content of the case study before you answer the questions. Clicking these buttons displays information such as business requirements, existing environment, and problem statements. If the case study has an All Information tab, note that the information displayed is identical to the information displayed on the subsequent tabs. When you are ready to answer a question, click the Question button to return to the question.
Overview
Existing Environment
Contoso, Ltd. is a manufacturing company that produces outdoor equipment. Contoso has quarterly board meetings for which financial analysts manually prepare Microsoft Excel reports, including profit and loss statements for each of the company's four business units, a company balance sheet, and net income projections for the next quarter.
Data and Sources
Data for the reports comes from three sources. Detailed revenue, cost, and expense data comes from an Azure SQL database. Summary balance sheet data comes from Microsoft Dynamics 365 Business Central.
The balance sheet data is not related to the profit and loss results, other than they both relate dates.
Monthly revenue and expense projections for the next quarter come from a Microsoft SharePoint Online list.
Quarterly projections relate to the profit and loss results by using the following shared dimensions: date, business unit, department, and product category.
Net Income Projection Data
Net income projection data is stored in a SharePoint Online list named Projections in the format shown in the following table.
Revenue projections are set at the monthly level and summed to show projections for the quarter.
Balance Sheet Data
The balance sheet data is imported with final balances for each account per month in the format shown in the following table.
There is always a row for each account for each month in the balance sheet data.
Dynamics 365 Business Central Data
Business Central contains a product catalog that shows how products roll up to product categories, which roll up to business units.
Revenue data is provided at the date and product level. Expense data is provided at the date and department level.
Business Issues
Historically, it has taken two analysts a week to prepare the reports for the quarterly board meetings. Also, there is usually at least one issue each quarter where a value in a report is wrong because of a bad cell reference in an Excel formula. On occasion, there are conflicting results in the reports because the products and departments that roll up to each business unit are not defined consistently.
Requirements
Planned Changes
Contoso plans to automate and standardize the quarterly reporting process by using Microsoft Power BI. The company wants to how long it takes to populate reports to less than two days. The company wants to create common logic for business units, products, and departments to be used across all reports, including, but not limited, to the quarterly reporting for the board.
Technical Requirements
Contoso wants the reports and datasets refreshed with minimal manual effort.
The company wants to provide a single package of reports to the board that contains custom navigation and links to supplementary information.
Maintenance, including manually updating data and access, must be minimized as much as possible.
Security Requirements
The reports must be made available to the board from powerbi.com. A mail-enabled security group will be used to share information with the board.
The analysts responsible for each business unit must see all the data the board sees, except the profit and loss data, which must be restricted to only their business unit's data. The analysts must be able to build new reports from the dataset that contains the profit and loss data, but any reports that the analysts build must not be included in the quarterly reports for the board. The analysts must not be able to share the quarterly reports with anyone.
Report Requirements
You plan to relate the balance sheet to a standard date table in Power BI in a many-to-one relationship based on the last day of the month. At least one of the balance sheet reports in the quarterly reporting package must show the ending balances for the quarter, as well as for the previous quarter.
Projections must contain a column named RevenueProjection that contains the revenue projection amounts. A relationship must be created from Projections to a table named Date that contains the columns shown in the following table.
The relationships between products and departments to business units must be consistent across all reports.
The board must be able to get the following information from the quarterly reports:
* Revenue trends over time
* Ending balances for each account
* A comparison of expenses versus projections by quarter
* Changes in long-term liabilities from the previous quarter
* A comparison of quarterly revenue versus the same quarter during the prior year
NEW QUESTION 49
You are modeling data in table named SalesDetail by using Microsoft Power Bl.
You need to provide end users with access to the summary statistics about the SalesDetail data. The users require insights on the completeness of the data and the value distributions.
Which three actions should you perform in sequence? To answer, move the appropriate actions from the list of actions to the answer area and arrange them in the correct order.
Answer:
Explanation:
1 - Create a blank query as a data source.
2 - Specify the following query. = Table.Profile(#"SalesDetail")
3 - Create a visual for the query table.
Explanation:
NEW QUESTION 50
Note: This question is part of a series of questions that use the same scenario. For your convenience, the scenario is repeated in each question. Each question presents a different goal and answer choices, but the text of the scenario is the same in each question in this series.
You have a Microsoft SQL Server database that contains the following tables.
The following columns contain date information:
- Date[Month] in the mmyyyy format
- Date[Date_ID] in the ddmmyyyy format
- Date[Date_name] in the mm/dd/yyyy format
- Monthly_returns[Month_ID] in the mmyyyy format
The Order table contains more than one million rows.
The Store table has a relationship to the Monthly_returns table on the Store_ID column. This is the only relationship between the tables.
You plan to use Power BI Desktop to create an analytics solution for the data.
You need to create a relationship between the Monthly_returns table and Date[Date_ID].
What should you do before you create the relationship?
- A. In the Date table, create a new calculated column named Month_ID that uses the yyyydd format.
- B. To the Date table, add a calculated column that uses the RELATED(Monthly_returns[Month_ID]) DAX formula.
- C. To the Order table, add a calculated column that uses the RELATED(Monthly_returns[Month_ID]) DAX formula.
- D. In the Monthly_returns table, create a new calculated column named Date_ID that uses the ddmmyyyy format.
Answer: D
Explanation:
https://docs.microsoft.com/en-us/power-bi/desktop-create-and-manage-relationships
NEW QUESTION 51
You are creating a Microsoft Power Bl model that has two tables named CityData and Sales. CityData contains only the data shown in the following table.
Sales contains only the data shown in the following table.
For each of the following statements, select Yes if the statement is true. Otherwise, select No.
NOTE: Each correct selection is worth one point.
Answer:
Explanation:
NEW QUESTION 52
You are creating a Microsoft Power Bl imported data model to perform basket analysis. The goal of the analysis is to identify which products are usually bought together in the same transaction across and within sales territories.
You import a fact table named Sales as shown in the exhibit. (Click the Exhibit tab.)
The related dimension tables are imported into the model.
Sales contains the data shown in the following table.
Answer:
Explanation:
NEW QUESTION 53
......
DA-100 dumps Exam Material with 150 Questions: https://braindumps.getvalidtest.com/DA-100-brain-dumps.html